The empirical canopy conductance calculation and the arbitrary prescription of vegetation phenology were recognized weaknesses of SiB1.
Two scientific developments prompted a radical revision of SiBl and its associated datasets. First, work carried out in the 1980s and early 1990s by plant physiologists and ecologists provided new insights into the biochemical mechanisms governing photosynthesis and how these are tied to stomatal function (see, for example, Farquhar et al. 1980; Ball 1988; Collatz et al. 1990; Collatz et al. 1991). Further work by Field
Second, optical remote sensing of the land surface matured during the 1980s as a result of global diagnostic studies using satellite data (Tucker et al. 1986);plot-scale field studies (Asrar et al. 1984; Tucker et al.1981); large-scale field experiments (Sellers et al.1992b; Hall et al. 1992); and theoretical work (Myneni et al. 1992; Hall et al. 1990; Sellers 1985, 1987; Sellers et al. 1992a). It was shown that satellite observations of the surface in the visible and near-infrared wavelengths could be combined into spectral vegetation indices (SVIs) to provide useful estimates of the fraction of photosynthetically active radiation (0.4-0.7 fim) absorbed by the green part of the vegetation canopy(FPAR). This FPAR term can be directly applied in the integrated canopy photosynthesis - conductance model of Sellers et al. (1992a) to calculate photosynthesis and transpiration over large areas (see Sellers et al. 1992c). These two new developments complement each other perfectly; the more realistic canopy process models (which actually require fewer parameters than the highly empirical physiological models used in SiB 1) can be applied globally using satellite spectral vegetation index (SVI) data to define the time-space variations in vegetation activity. At a stroke, the two major weaknesses of SiBl, the empirical canopy conductance model and the arbitrary prescription of vegetation phenology, could be mitigated.
These and a number of other changes made to SiB1 to create SiB2 can be summarized as follows:
(i)A realistic photosynthesis-conductance model is incorporated to describe the simultaneous transfers of C02 and water vapor into and out of the leaf, respectively.
(ii)Satellite data is used to describe the vegetation phenology. Simple ratio vegetation index (SR) data acquired from the Advanced Very High Resolution Radiometer (AVHRR) sensor on the NOAA series of meteorological satellites were processed to derive time-series fields of the fraction of photosynthetically active radiation absorbed by the green vegetation canopy(FPAR), the total LAI (Lr), and the canopy greenness fraction (A^). FPAR is used directly in the photosyn-thesis-conductance calculation, while Lris used in the specification of land surface turbulent transfer and re-flectance properties.
(iii)The hydrological submodel is modified to give better descriptions of base flows and a more reliable calculation of interlayer exchanges within the soil profile.
(iv) A (i) * * 4'patchy'5 snowmelt description is incorpo-rated that prevents rapid thermal transitions when the area-averaged snow cover is low and decreasing. To accommodate the changes described in (i) and (ii), the two-layer canopy structure used in SiBl was reduced to a single vegetation layer in SiB2. These improvements are reviewed in this paper. A companion paper, Sellers et al. (1996), describes the new datasets used by SiB2, in particular those data derived from satellite observations. A third paper, Randall et al. (1996), describes the performance of the coupled SiB2-GCM combination. In this form, SiB2-GCM calculates the conventional land-surface-atmosphere fluxes of radiation, momentum, and sensible and latent heat. In the process, the models calculate the globalscale uptake of carbon by terrestrial plants in photo-synthesis, that is, gross primary productivity (GPP).
The empirical species-specific canopy resistance formulation and the specification of global times-series fields of LAI, etc., from in situ observations were known to be large sources of uncertainty. SiB2 includes two major improvements over SiBl to address these shortcomings.
(i) Incorporation of more realistic leaf- and canopy-scale models of photosynthesis conductance.
(ii) Global specification of the green LAI from satellite remote sensing data.

a.Atmospheric boundary conditions
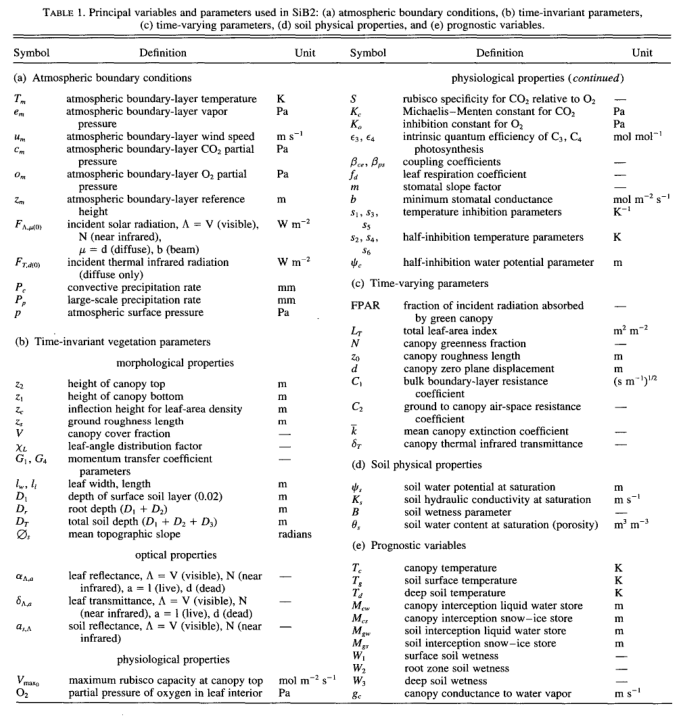
The atmospheric boundary conditions necessary to force SiB2 are listed in Table la and include the following:
(i)Air temperature Tm, vapor pressure em9 wind speed Mm, and C02 and 02 concentration cm and om at a reference level, zm, within the atmospheric boundary layer. In practice, mean values of cm and om can be defined (35 and 2090 Pa, respectively) for current atmospheric conditions.
(ii)Components of the incident radiation FAiM(0):visible (direct and diffuse), near-infrared (direct and diffuse), and thermal (diffuse only) components of the incident radiative flux.
(iii)Convective Pc and large-scale P/ precipitationrates: a simple formula is used in SiB2,to distribute convective rainfall nonuniformly within a grid area.Lai'ge-scale precipitation is assumed to be spatially uniform.
b.Time-invariant vegetation and ground parameters
SiB1 had two vegetation layers. It was necessary to reduce these to one layer in SiB2 to incorporate the iterative photosynthesis-conductance model (see section 7) and to make use of satellite data to describe surface parameters (see Sellers et al. 1996). Table 2 shows how this was done: vegetation types 6, 7, 8, and11 in SiBl (savannah, perennial grassland, shrubs with grassland, and bare soil-desert,respectively) were assigned properties associated with a single vegetation type in SiB2, C4 grassland, which is assumed to be the dominant vegetation type in these areas. Note that since vegetation density is specified from satellite data in SiB2, the assignment of a vegetation type to a ‘‘pure desert” area is almost irrelevant since it will have no significant vegetation cover specified there anyway. The agricultural areas (winter wheat and broadleaf trees) in SiB 1 were assigned properties associated with a C3 grassland-agriculture cover. These changes also involved some adjustments in the areas occupied by the newly specified C4 and C3 grassland agricultural covers (see text and figures in Sellers et al. 1996). The net result of these changes is that there are now effectively only nine vegetation types in SiB2, all of which have only one story. This simplification reduces the realism of SiB2 in areas that in nature have two-story vegetation covers, such as savannah where C3 trees overlie C4 grasslands.
c.Time-varying vegetation parameters
Table lc lists the time-varying vegetation parameters used in SiB2. These are generated from satellite data using the methods described in Sellers et al. (1996) and include the fraction of photosynthetically active radiation absorbed by the canopy FPAR, that is, by NLT, total leaf-area index Lr, the canopy greenness fraction N, and the aerodynamic parameters defined in section 6.
d.Soil physical properties of SiB
In SiB 1, soil properties were assigned to each vegetation type in much the same way as the time-invariant vegetation properties listed in Table lc. However, soil properties exhibit regional variations that can be independent of vegetation type, and vice versa. This became apparent in SiBl when a single soil type and associated parameter set was assigned to all desert areas in the world. This resulted in an overestimation of the albedo of the deserts of Australia and Northwest America, which had been assigned high soil reflectance values representative of the Sahara. In SiB2, the Food and Agriculture Organization (FAO) global soil-type map as presented by Zobler (1986) was combined with a table of soil properties to produce global fields of the soil physical properties ^SiKs,B,6s, listed in Table Id (see also Sellers et al. 1996). Soil optical properties are still assigned by vegetation type by default; however, the satellite-based surface reflectance dataset of Harrison et al. (1990) is applied in desert areas (see Sellers et al. 1996). Soil-layer depths are defined as a function of vegetation type.


e.Prognostic physical state variables of SiB2 and their governing equations
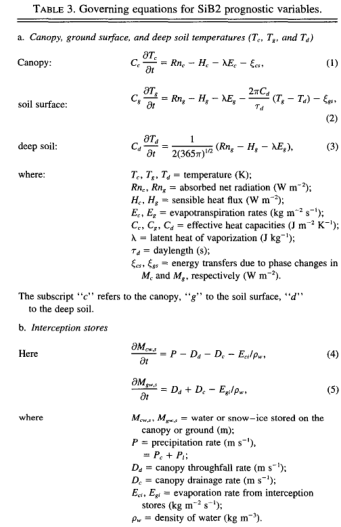
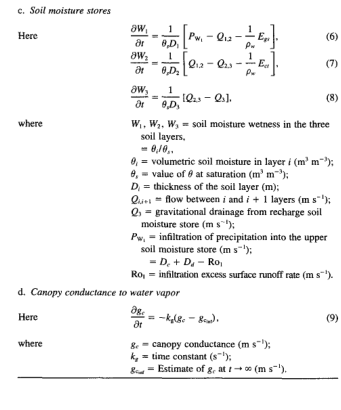
SiB2 has eleven prognostic physical state variables: three temperatures (canopy temperature Tc, soil surface temperature Tg, deep soil temperature Td)\ two interception water stores (canopy water MCWi soil surface Msw)\ two interception snow/ice stores (Mcs, Mgs)\three soil moisture wetness values (Wu W2, and W3); and one prognostic (time stepped) value of canopy conductance [gc( = l/rc)]. The governing equations, (1) through (9), for these variables are shown in Table 3.
The evapotranspiration from the canopy £"c has two components (i) Eci, evaporation of water from snow/ice or water intercepted by the canopy and (ii) Ect,transpiration of soil water extracted by the root system and lost from the dry fraction of the canopy. Similarly,evaporation from the soil surface consists of (i) Egi,loss from snow/ice and ‘‘puddled’’ water held on tie soil surface, and (ii) Egs, evaporation of soil moisture from within the top soil layer. In (4) and (5) in Table 3, the canopy or ground interception stores in a grid area are either in snow/ice or in liquid water forms prior to precipitation interception. If the precipitation is in a different phase from tiie stored water, a calculation of phase changes and substrate temperature changes ensues; if snow/ice and liquid water coexist after this calculation, the liquid water is lost to drainage, runoff, or infiltration (see section 8of this paper). Also in (4) and (5), evaporation lossesfrom snow/ice take into account the extra energy required for sublimation [see (33)].
The use of (9) in Table 3 has two advantages over the conventional steady-state calculations for gc described by Collatz et al. (1991) and Sellers et al.(1992a). It produces a realistic lag in stomatal response and is computationally far more efficient as it eliminates one complete iterative loop (see appendix C).In the numerical solution of the prognostic equations for Tc and Tg, we make use of the fact that the heat capacity terms, Cc and Cg, are small relative to the energy fluxes Rn, H, and \E. This makes (1) and (2)“fast:” response equations so that changes in rc and even over a short time step of a few minutes can have a significant feedback on the magnitude of the calculated energy fluxes.
The energy fluxes Rn, H, and \E and the assimilation rate A are explicit functions of (i) the atmospheric boundary conditions (see Table la); (ii) the prognostic variables of SiB2 (see Table le); (iii) the three aerodynamic resistances ra, rb, and rd and (iv) the two surface resistances rc {=\gc) and rsoil (=l/gsoil) (seeFig. 2). These fluxes are involved in a backward-differencing scheme to calculate the changes in Tc and Tg over a time step At. After thal:, the various moisture fluxes predicted by the model are used to update the moisture stores: Mcw,s, Mgw,s, and W2,W2 and W3 (see section 10).


