Quoted from: https://github.com/FlexiGIS/FlexiGIS
FlexiGIS stands for Flexibilisation in Geographic Information Systems (GIS). It extracts, filters and categorises the geo-referenced urban energy infrastructure, simulates the local electricity consumption and power generation from on-site renewable energy resources, and allocates the required decentralised storage in urban settings. FlexiGIS investigates systematically different scenarios of self-consumption, it analyses the characteristics and roles of flexibilisation technologies in promoting higher autarky levels in cities. The extracted urban energy infrastructure are based mainly on OpenStreetMap data.
FlexiGIS Components
Module I: FlexiGIS urban spatial platform
This package establishes urban energy infrastructure. It extracts, acquires and processes urban georeferenced data extracted from OpenStreetMap. In order to extract the OpenStreetMap georeferenced datasets of urban energy infrustructure datasets and its required features, Module I derives an automatised extraction procedure. Firstly, the raw OpenStreetMap data is downloaded from the OpenStreetMap database for the invistigated urban space from Geofabrik. Second, the OpenStreetMap datasets are filtered for the respective case study defined by the provided .POLY file using the open source java tool osmosis. The OpenStreetMap data are filtered for the follwoing OSM elements:
- landuse = * tag provides information about the human use of land in the respective area (see Figure 1)
- building = * tag describes all mapped objects considered as buildings of different categories, example residential, schools, etc. (see Figure 2)
- highway = * tag describes all lines considered as streets, roads, paths, etc. (see Figure 3)
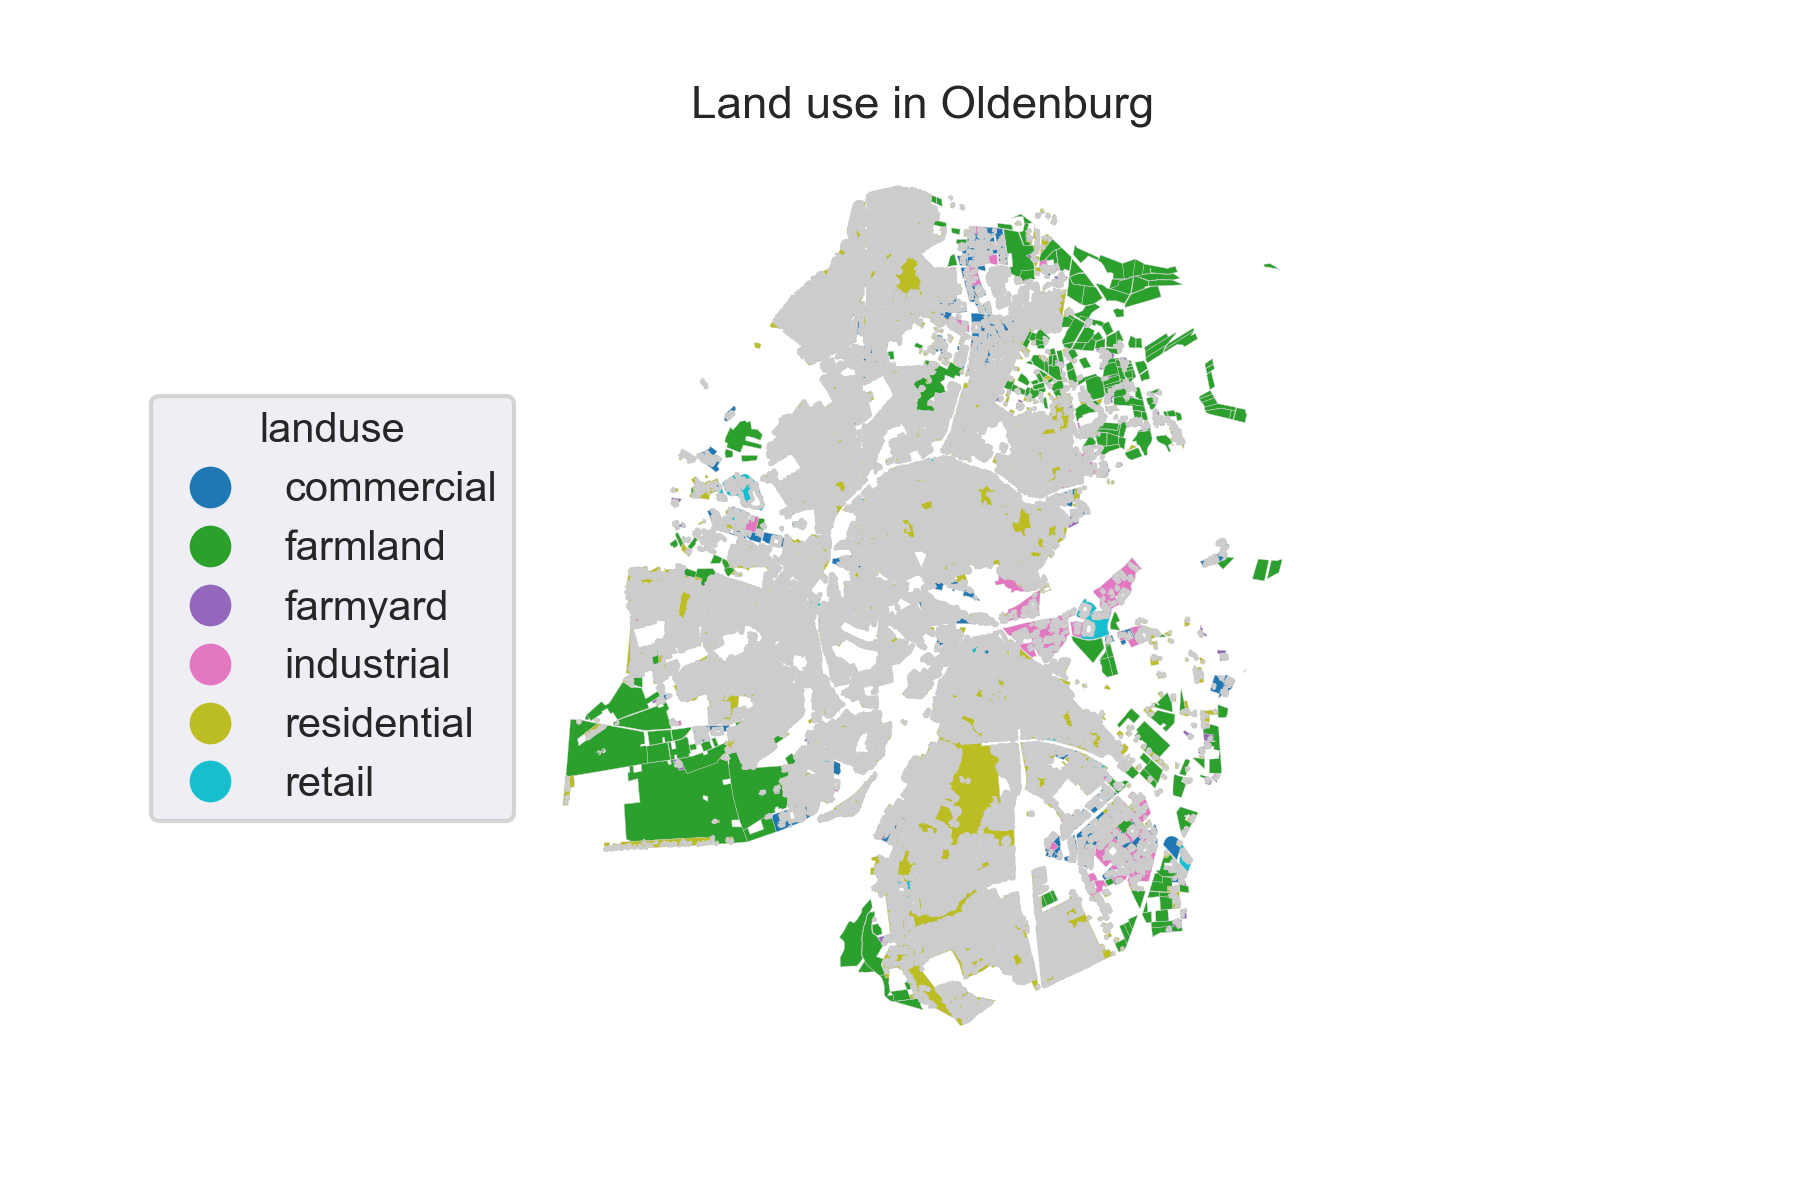
Fig. 1. Extracted OpenStreetMap landuse datasets for the city of Oldenburg. Credits: OpenStreetMap contributors. 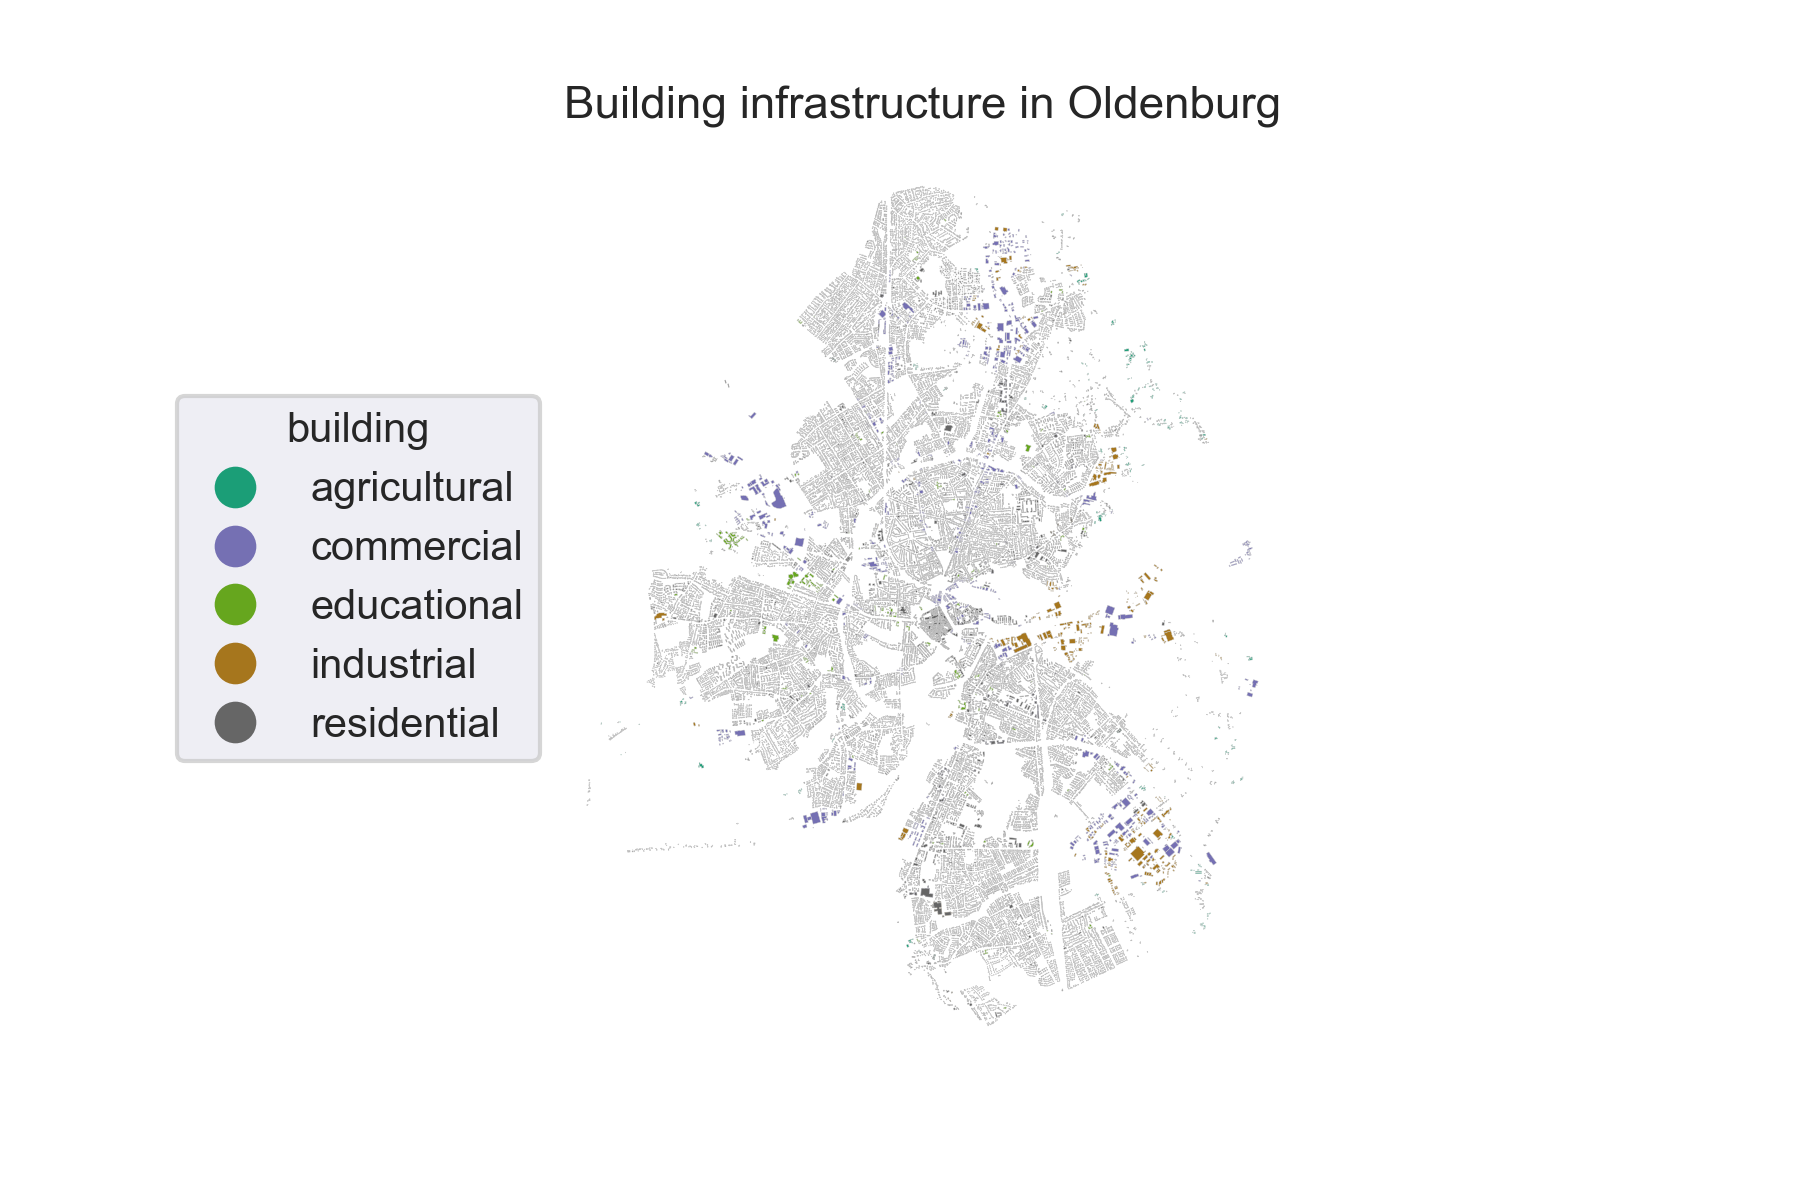
Fig. 2. Extracted OpenStreetMap building datasets for the city of Oldenburg. Credits: OpenStreetMap contributors. 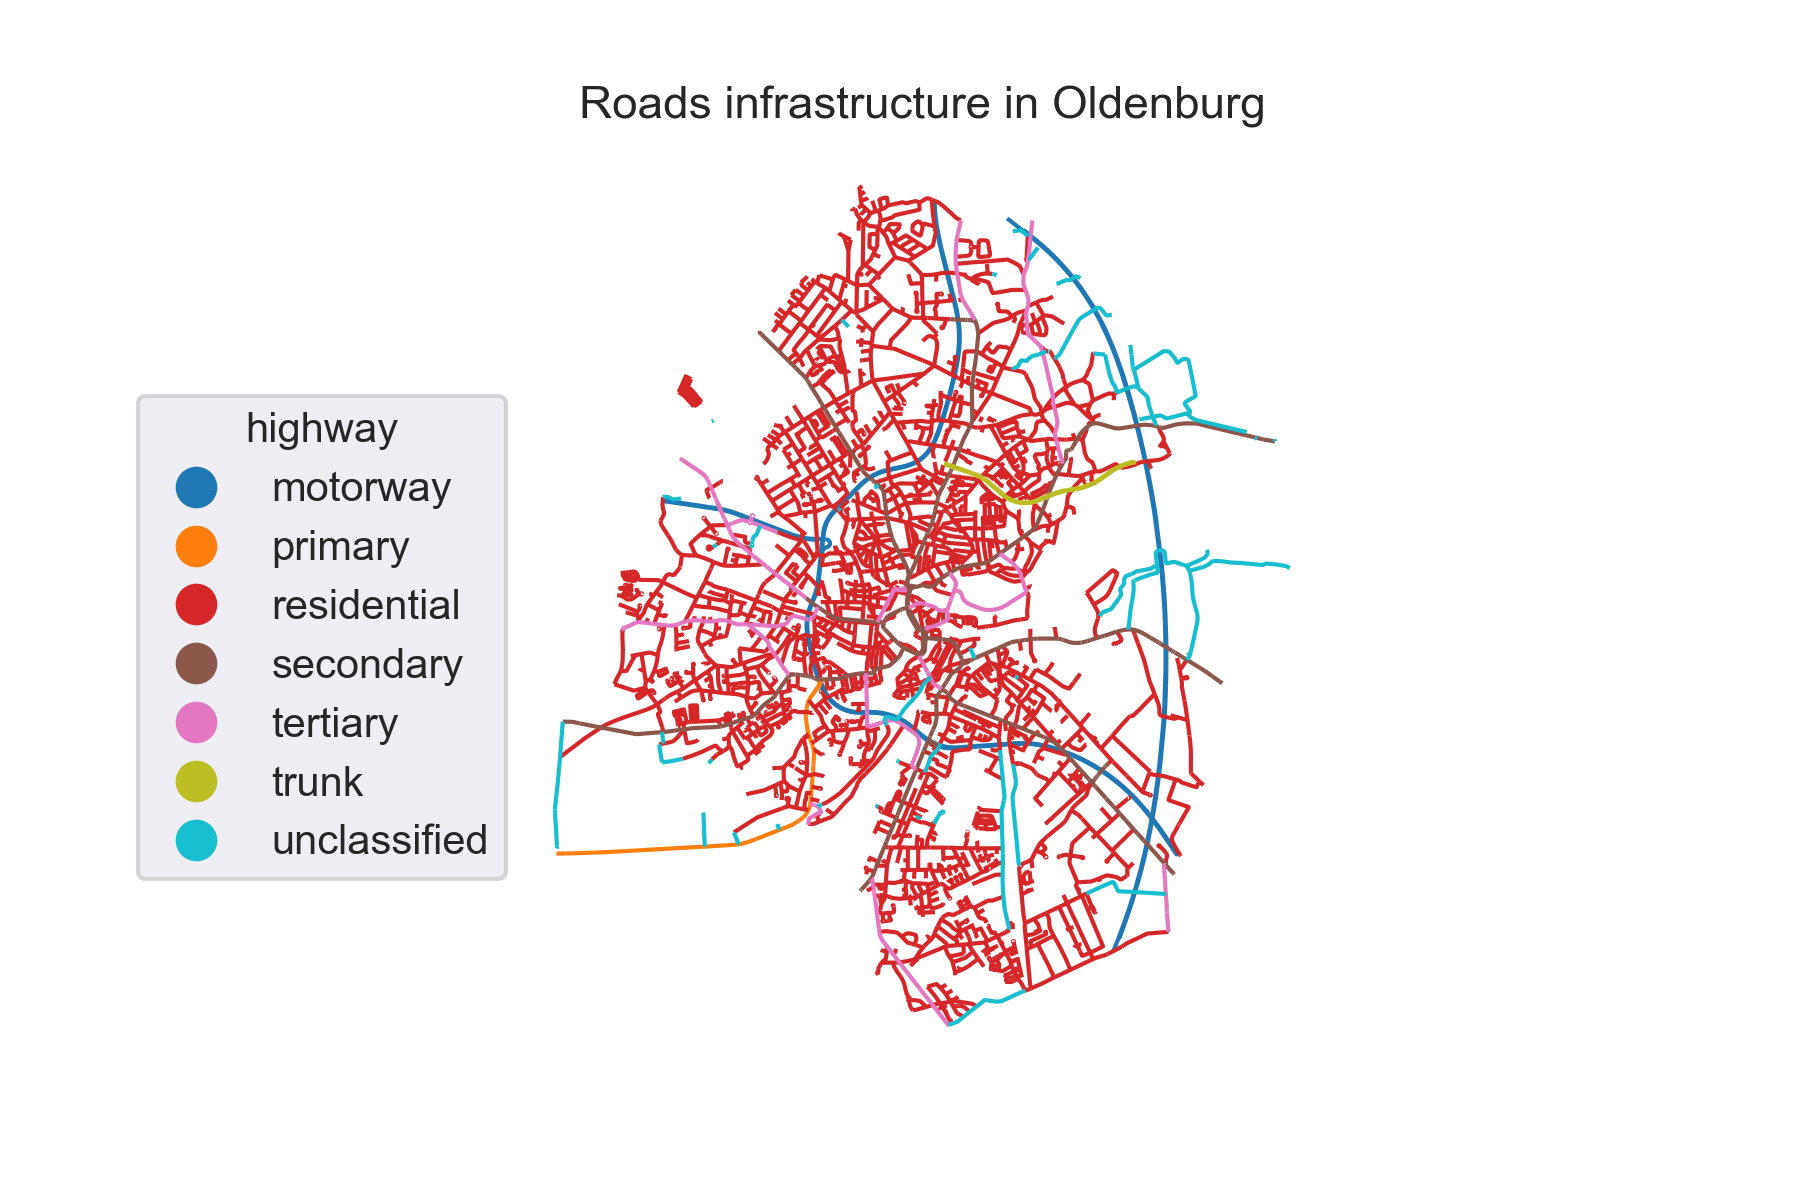
Fig. 3. Extracted OpenStreetMap highway datasets for the city of Oldenburg. Credits: OpenStreetMap contributors.
After filtering the OSM raw data, the georeferenced building and roard infrastructure in the city of Oldenburg are exported to a relational postgis-enabled database using the open source osm2pgsql. Theses datasets can be exported as CSV files or visualised as maps (see Figures 1-3).
Module II: FlexiGIS temporal dimension
It simulates urban energy requirments (consumption and generation). The spatio-temporal electricity consumption and renewable energy generation from PV and wind in the defined urban area are modelled. This component models the combined spatial parameters of urban geometries (Module I) and linkes them to real-world applications using GIS. Here, a bottom-up simulation approach is developed to calculate local urban electricity demand and power generation from available renewable energy resources. For instance, using open source datases like Standardised Load Profiles and publicaly available weather data, Figure 4 shows the generated quarter-hourly time series of the aggregated load and PV power supply profile for invistigated case study. The PV and wind power supply are simulated using feedinlib python package.

Fig. 4. Simulated electricity consumption (green) and solar power generation (red) for the city of Oldenburg.
Module III: Optimisation of flexibility options
The spatial-temporal simulation outputs from Module I and II are time series of electricity demand and supply. Theses generated datasets will be used by the oemof/solph model as inputs to the linear optimisation problem. This module aims to determine the minimum system costs at the given spatial urban scale while matching simultenously the simulated electricity demand. In addition, it aims to allocate and optimise distributed storage and other flexibility options in urban energy systems.
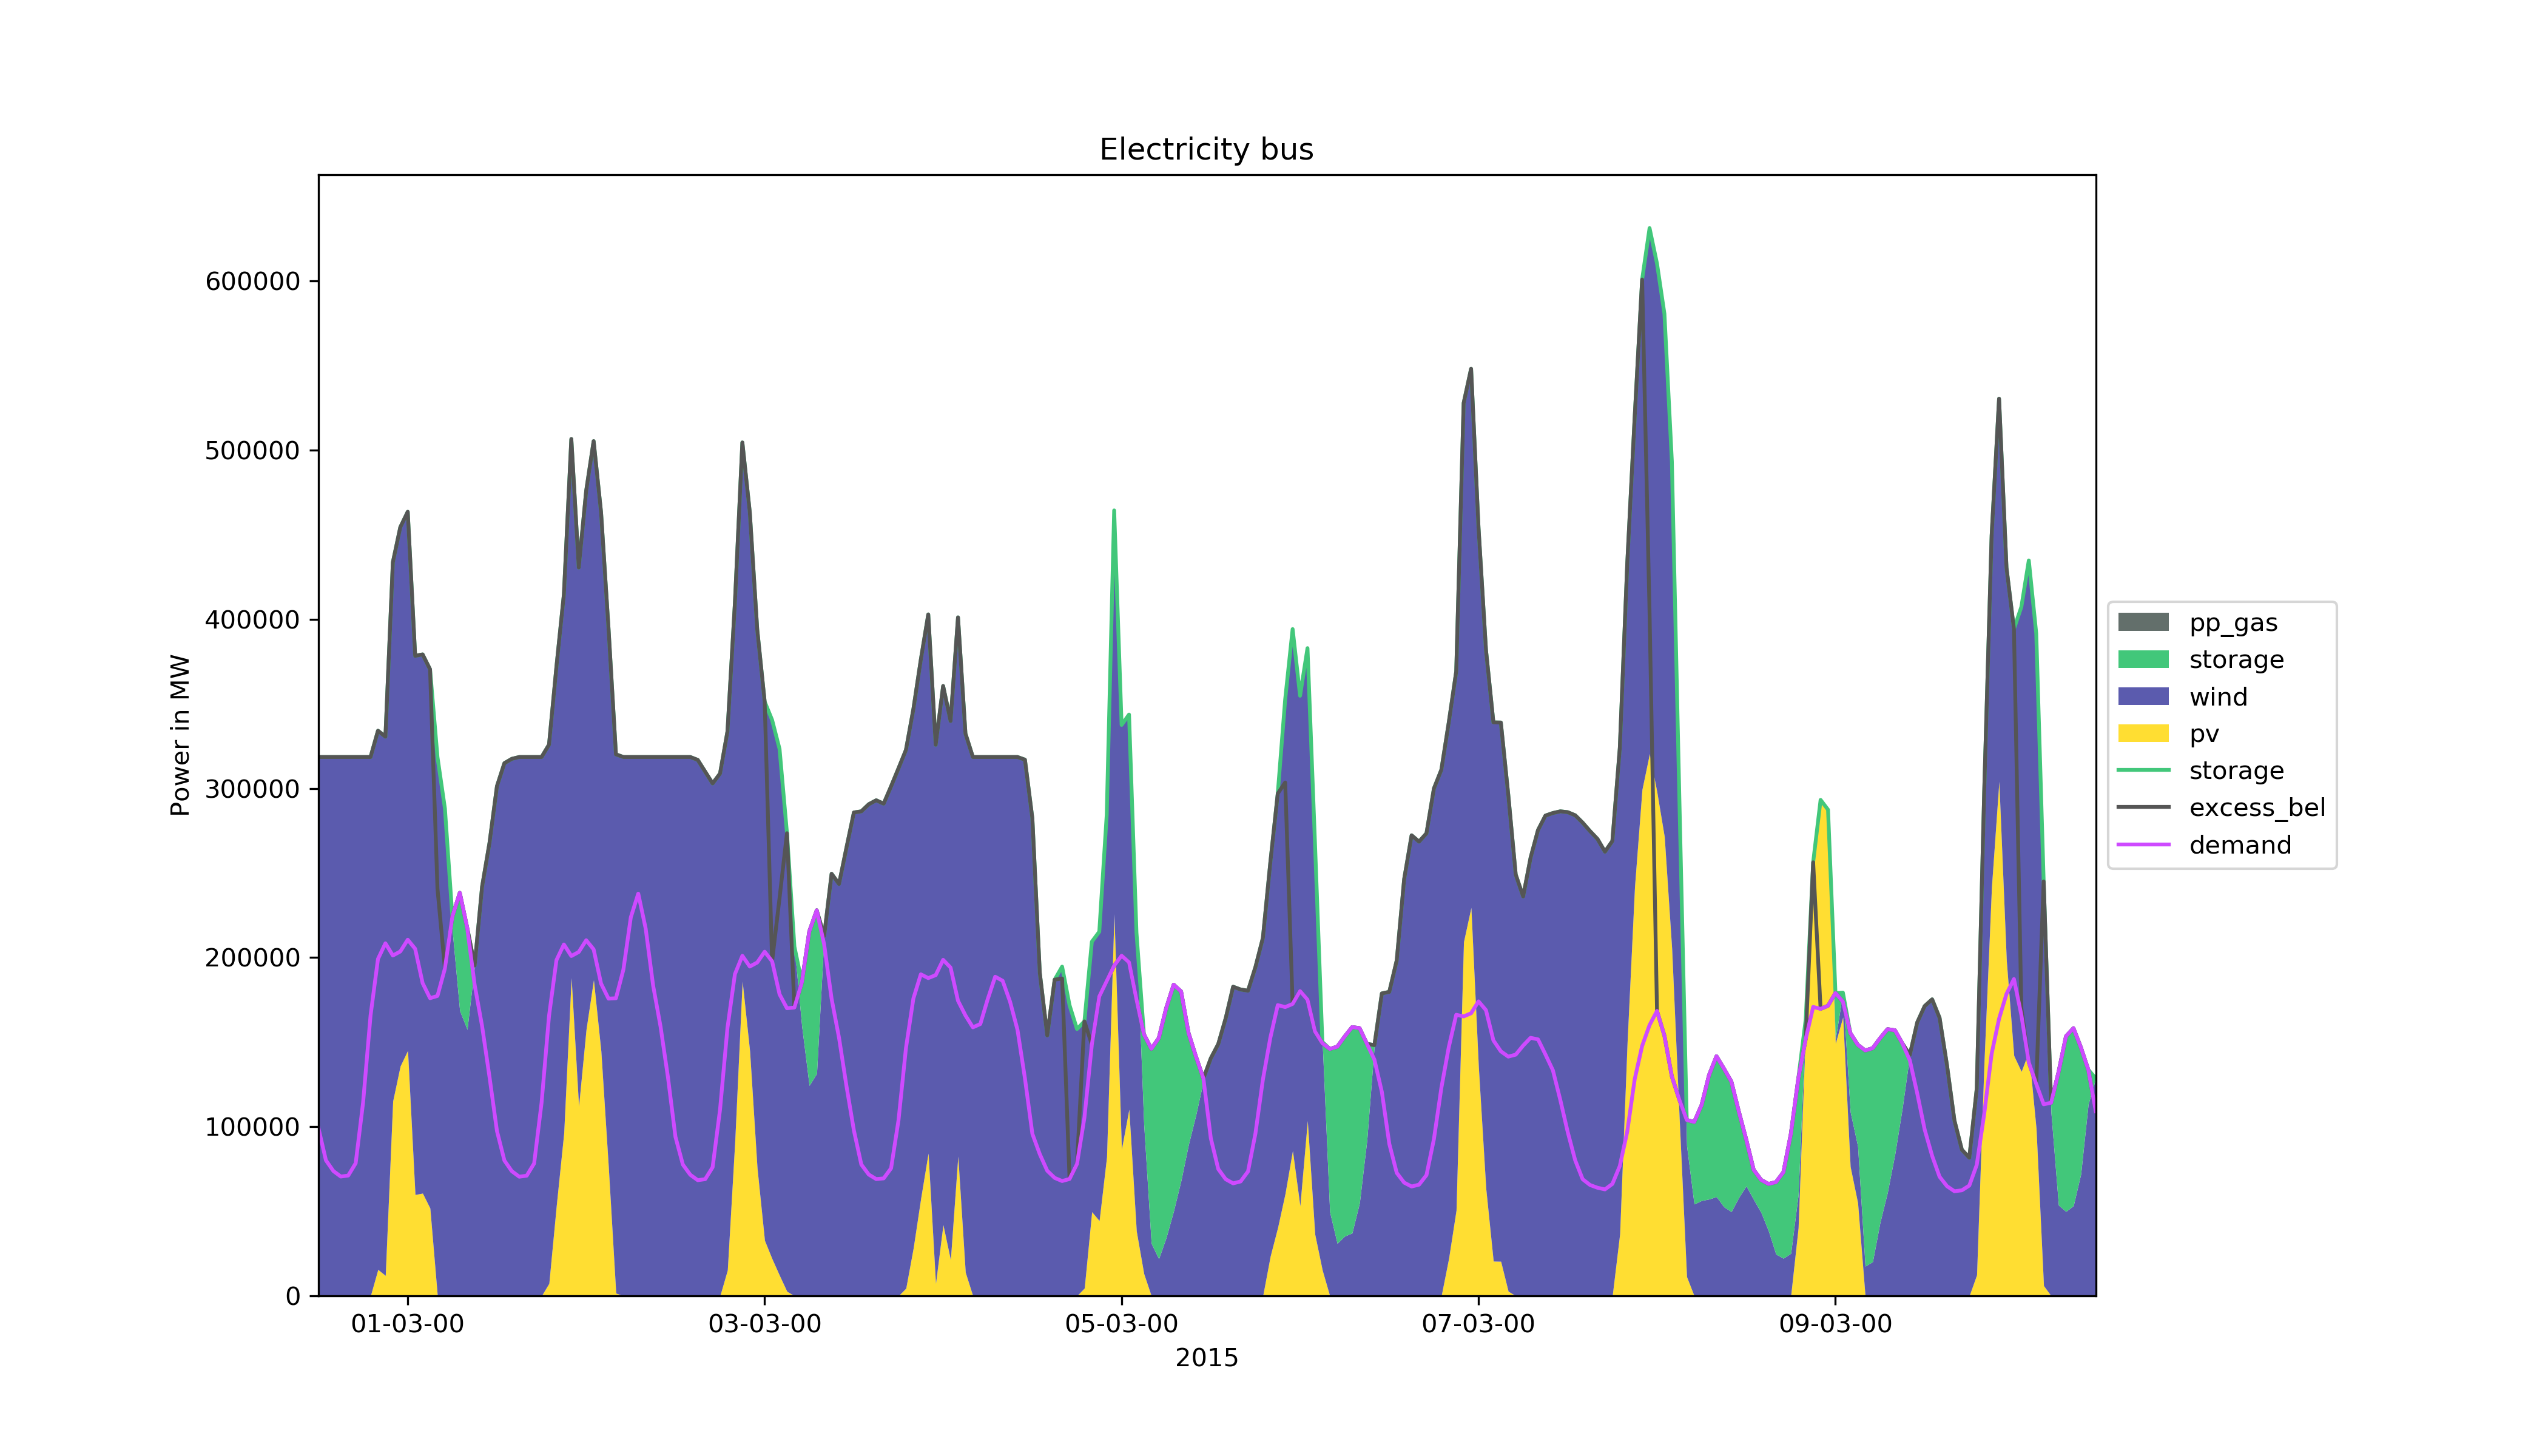
Fig. 5. Example result of optimal energy requirements, which minimize investement cost simulated for the city of Oldenburg.
System requirements
FlexiGIS is developed and tested on Linux (Ubuntu 16.04.6). The tools and software used in FlexiGIS and their versions are listed in the following:
- Operating system: Ubuntu 16.04.6 LTS, Release: 16.04, Codename: xenial
- PostgreSQL version: 11.2 (64-bit)
- PostGIS version: 1.5.3
- osmosis version: 0.44.1
- osm2pgsql version: 0.88.1 (64bit id space)
- GNU Make version: 4.2.1
- Python: 3.6.7
- GNU bash: 4.3.48(1)-release (x86_64-pc-linux-gnu)
PostgreSQL: To install PostgreSQL, refer to the PostgreSQL webpag. Please note that you need at least the version or higher to run FlexiGIS.
Osmosis: To use Osmosis, unzip the distribution in the location of your choice. On unix/linux systems, make the bin/osmosis script executable (ie. chmod u+x osmosis). If desired, create a symbolic link to the osmosis script somewhere on your path (eg. ln -s appdir/bin/osmosis ~/bin/osmosis).
osm2pgsql: Instruction are available on how to download and install osm2pgsql for Linux systems on the osm2pgsql webpage.
Python: Ensure you can run python (with version 3 and above) on your OS. Python can be downloaded following this link or download the Anaconda distro.
cbc solver: See here for cbc installation instruction.
Getting Started
To use the FlexiGIS spatial-temporal platform download the FlexiGIS code and data folder as a zip file or clone the repository from the FlexiGIS GitHub repo. After downloading the FlexiGIS code, unzip the folder FlexiGIS in the location of your choice. The file structure of the FlexiGIS code folder is as follows:
- FlexiGIS
- ├── code
- ├── data
- │ ├── 01_raw_input_data
- │ ├── 02_urban_output_data
- │ ├── 03_urban_energy_requirements
- │ └── 04_Visualisation
- ├── doc
- ├── README.md
- └── requirements.txt
Installation
After making sure all system requirements are satisfied, clone FlexiGIS repo create a Python virtual environment where the required python dependencies can be installed using. Python virtual environment can be created by following the tutorial steps from here.
First clone the FlexiGIS code from the GitHub repository. In the next step, create a Python virtual environment (give a name e.g. _env_name) where the required python dependencies can be installed using pip, then activate the virtual environment.
user@terminal:~$ git clone https://github.com/FlexiGIS/FlexiGIS.git
user@terminal:~$ python3 -m venv _env_name
user@terminal:~$ source _env_name/bin/activate
After creating and activativating the python virtual environment, cd into the cloned FlexiGIS directory, and install the required python dependencies.
(_env_name) user@terminal:~$ cd ../FlexiGIS
(_env_name) user@terminal:~/FlexiGIS$ pip install -r requirements.txt
clone the oemof/feedinlib package from flexigis github repository(recommended) and install localy for the renewable feedin simulations. Also install the oemof/solph python package for the modelling and optimization of energy systems. An additional eomof package oemof_visio is required as a dependency for generating nice plots of the optimization results. Note: The default solver used here for the linear optimization by FlexiGIS is the cbc slover
(_env_name) user@terminal:~/FlexiGIS$ git clone https://github.com/FlexiGIS/feedinlib.git
(_env_name) user@terminal:~/FlexiGIS$ pip install -e feedinlib
(_env_name) user@terminal:~/FlexiGIS$ pip install oemof.solph
(_env_name) user@terminal:~/FlexiGIS$ pip install git+https://github.com/oemof/oemof_visio.git
Now you are ready to excute FlexiGIS using the make commands.
Running FlexiGIS
To run the first two components of the FlexiGIS package, execute the following steps:
-
After completing the setting up of FlexiGIS environment as mentioned in the steps above, go to the folder code, check the parameters in config.mk file.
-
Ensure that your database parameters are properly set in the config.mk file, and also the OSM data link of the spartial location of choice.
-
Ensure the poly file of the spartial location of choice is available in the data/01_raw_input_data directory before running FlexiGIS.
The available makefile options are:
To run the available makefile options, go into the code folder of the flexigis directory in your linux terminal, then run
(_env_name) user@terminal:~/FlexiGIS/code$ make all
make-all executes multiple make options, from download to the simulation of load and PV profiles for the urban infrastructures, and finally the optimization of electricity supply and the alocated storage system. However, instead of running 'make all', you can run the various steps one after the other as decribed in the documentation.
(_env_name) user@terminal:~/FlexiGIS/code$ make weather_data
'make weather_data' downloads ECMWF ERA5 weather data of a location or region of interest from the climate data store (CDS) using the feedinlib interface.
(_env_name) user@terminal:~/FlexiGIS/code$ make feedin_data_format
'make feedin_data_format' prepares the dowloaded weather data into feedinlib format for feedin simulation.
(_env_name) user@terminal:~/FlexiGIS/code$ make example
'make example' can be run to generate an example simulation of aggregated load and PV profile for Oldenburg and also model the optimal allocated storage and onsite renewable supply. The example imports spatially filtered OSM Highway, landuse and building data stored as csv files in the ../data/01_raw_input_data/example_OSM_data folder. In other words, it runs all steps using the provided example data. Hence, the make example can be used as a test run of the flexigis package. After running the FlexiGIS package using the makefile commands, the resulting aggregated load and PV profiles, urban infrastructure data, and optimization results are stored in folder data/03_urban_energy_requirements, also static plots of the urban infrastructures and simulated load and PV profiles are created and stored in the data/04-visualisation folder. To visualise the extracted georeferenced urban infrastructures data interactively, the generated shape file of the extracted urban infrastructures, can be used in QGIS to generate interactive plots.
Documentation
Jump to documentation for more details about FlexiGIS.
Publications List
To see the list of publications jump to publications.
License
FlexiGIS is licensed under the BSD-3-Clause, "New BSD License" or "Modified BSD License".
The OpenStreetMap (OSM) data is available under the Open Database License (ODbL). A description of the ODbL license is available here. OpenStreetMap cartography is licensed as CC BY-SA. For more information on the copyright of OpenStreetMap please visit here.
Contact
Author: Alaa Alhamwi alaa.alhamwi@dlr.de
Project maintainer: Chinonso Unaichi chinonso.unaichi@dlr.de
Organisation: German Aerospace Center (DLR) - Institute of Networked Energy Systems, department for Energy system Analysis(ESY).
Project Team
Dr. Wided Medjroubi (project leader), Dr. Alaa Alhamwi (FlexiGIS main author), MSc. Chinonso C. Unaichi


