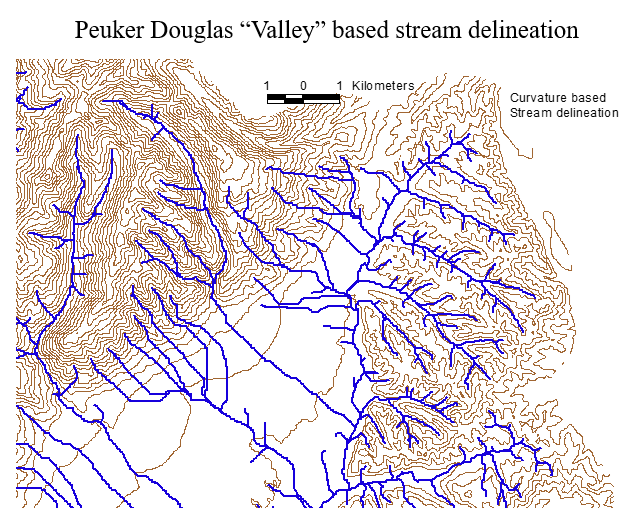
This tool combines the functionality of the "Peuker Douglas," "D8 Contributing Area," "Stream Drop Analysis," and "Stream Definition by Threshold" tools in order to generate a stream indicator grid (1,0) where the streams are located using a DEM curvature-based method. With this method, the DEM is first smoothed by a kernel with weights at the center, sides, and diagonals. The Peuker and Douglas (1975) method (also explained in Band, 1986), is then used to identify upwardly curving grid cells. This technique flags the entire grid, then examines in a single pass each quadrant of 4 grid cells, and unflags the highest. The remaining flagged cells are deemed 'upwardly curved', and when viewed, resemble a channel network. This proto-channel network sometimes lacks connectivity, and/or requires thinning, issues that were discussed in detail by Band (1986). The thinning and connecting of these grid cells is achieved here by computing the D8 contributing area using only these upwardly curving cells. An accumulation threshold on the number of these cells is then used to map the channel network where this threshold is optionally set by the user, or determined via drop analysis.
If drop analysis is used, then instead of providing a value for the accumulation threshold, the accumulation threshold value is determined by searching the range between the Drop Analysis Parameters "Lowest" and "Highest", using the number of steps in the parameter "Number". For the science behind drop analysis, see Tarboton, et al. (1991, 1992), and Tarboton and Ames (2001). The value of accumulation threshold that is selected is the smallest value where the absolute value of the t-statistic is less than 2. This is written to the drop analysis table text file. Drop analysis is only possible when outlets have been specified, because if an entire grid domain is analyzed, as the threshold varies, shorter streams draining off the edge may not meet the threshold criterion and be excluded from the analysis. This makes defining drainage density problematic and it is somewhat inconsistent to compare statistics evaluated over differing domains.