Quoted from: https://ccmc.gsfc.nasa.gov/models/models_at_glance.php
Model Description

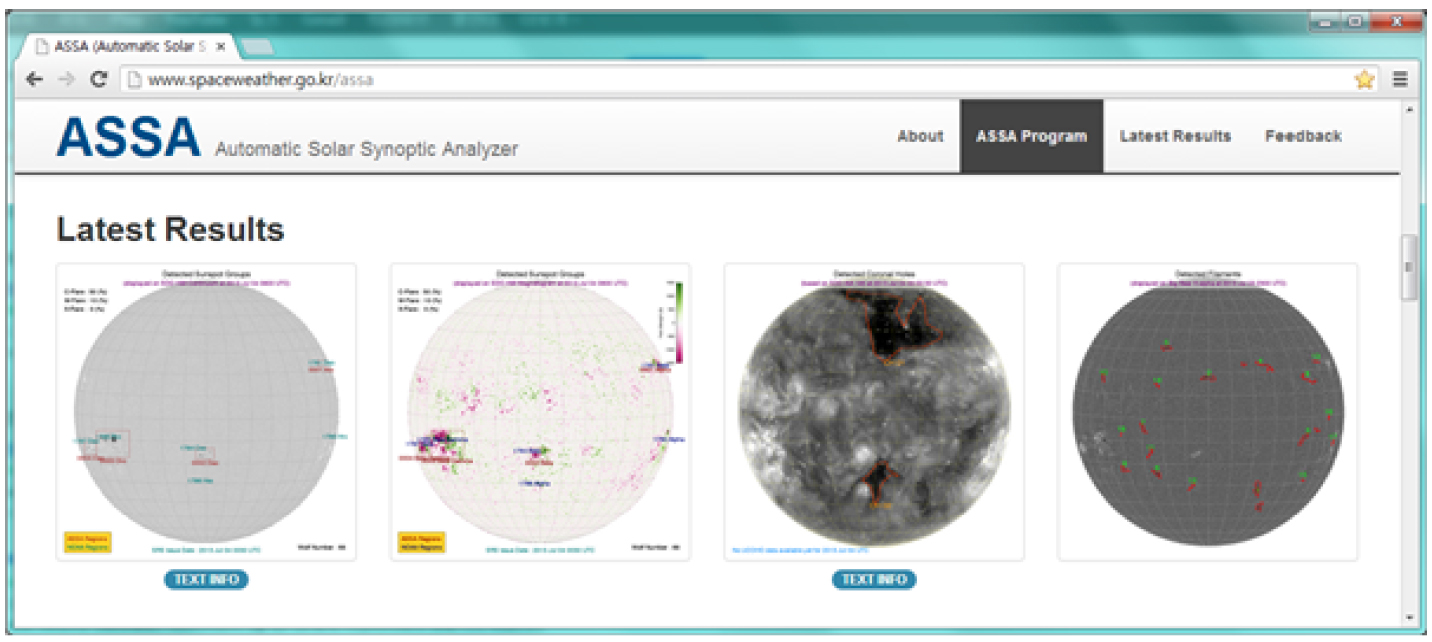
 The Automatic Solar Synoptic Analyzer (ASSA) is a fully automated software system of realtime monitoring and identification of key solar phenomena such as sunspot groups, coronal holes and filaments, those are three major solar sources causing the space weather.
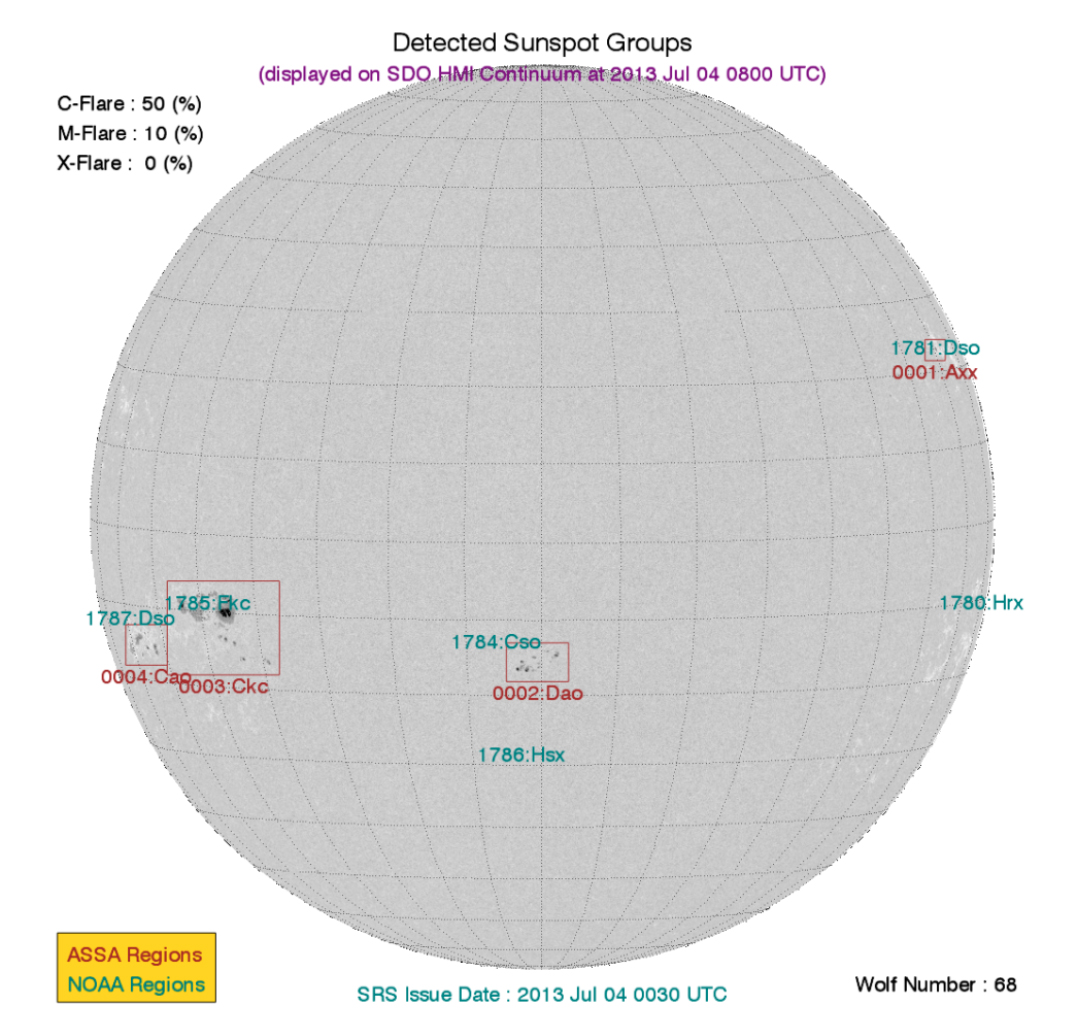
ASSA uses highresolution SDO HMI continuum and magnetogram data as inputs and identifying sunspot groups and providing McIntosh classification and Mt. Wilson magnetic classification of each active region. The pipeline of procedures for ASSA system include various kinds of image processing techniques including algorithms for intensity thresholding, morphological open/close, region growing and grouping based on the separation of each sunspot. Afterwards, each identified sunspot group is further processed to determine its McIntosh and Mt. Wilson magnetic class through estimation of quantitative parameters such as existence and maturity of penumbra, longitudinal coverage extent, compactness of sunspots aggregation, complexity of magnetic neutral lines, etc. The basic theory of classification scheme is based on SIDC user guide on sunspot group classification.
The flare probabilities for C/M/X class are provided. The C/M/X flare probabilities are based on the result of statistical analysis of the ASSA sunspot catalog and GOES Xray flare data. In generating the ASSA sunspot catalog, the SOHO MDI Continuum and Magnetogram images were collected for the period about 15 years from September 1996 to January 2011, which is covering a complete solar cycle (the cycle 23). Then, ASSA algorithm has been applied to the whole data set to obtain 15year sunspot catalog based on ASSA. The result of McIntosh classification for all sunspot groups are associated with Xray events catalog to yield C/M/X flare probability for each McIntosh class.
When identifying coronal holes and filament channels, images of SDO AIA 193 and global Halpha network are used for morphological identification. Especially, SDO HMI magnetograms are also used for quantitative verification of coronal hole based on polarity distribution. The output results of ASSA are routinely checked and validated against NOAA's daily SRS (Solar Region Summary) and UCOHO
Model Input
SDO HMI continuum http://jsoc.stanford.edu
SDO HMI magnetogram http://jsoc.stanford.edu/
SDO AIA 193 http://sdo.gsfc.nasa.gov/
GONG Halpha (BBSO) http://halpha.nso.edu/
GONG Halpha (Udaipur) http://halpha.nso.edu/
Solar Region Summary ftp://ftp.swpc.noaa.gov/
UCOHO ftp://ftp.swpc.noaa.gov/
Model Output
Image and text files of sunspot identification and classification result according to McIntosh and Mt. Wilson classification scheme along with flare probability according to McIntosh sunspot classification results
Image and text files of coronal hole identification results
Image and text files of filament channel identification results
References and relevant publications
1. Bloomfield, D. S., Higgins, P. A., McAteer, R. T. J., Gallagher, P. T., ApJL, 747, L41, 2012
2. Colak, T., and Qahwaji, R., Solar Physics, 248, 277, 2007
3. Krista, L. D. and Gallagher, P. T., Solar Physics, 256, 87, 2009
4. Shih, F. Y. and Kowalsky, A. J., Solar Physics, 218, 99, 2003
5. SangWoo Lee, JeungDeok Lee, Sunhak Hong, ASSA GUI User Manual, Version 1.07 ( http://www.spaceweather.go.kr/images/assa/ASSA_GUI_MANUAL.pdf )
6. Sunhak Hong, SangWoo Lee, ASSA evaluation report, Version 1.0
Acknowledgement
We used the solar images as input to the ASSA software those were supplied by the SDO/HMI and SDO/AIA consortia and the SOHO/MDI and SOHO/EIT consortia. The authors express special thanks to Mr. Kenneth Tegnell and Dr. Christopher Balch of NOAA Space Weather Prediction Center for sharing their knowledge and experiences on the sunspot analysis and the flare prediction.
Relevant links
ASSA official website: http://www.spaceweather.go.kr/assa
CCMC Contact(s)
Antti Pulkkinen
301-286-1648
Developer Contact(s)
Sangwoo Lee
Sunhak Hong


 The Automatic Solar Synoptic Analyzer (ASSA) is a fully automated software system of realtime monitoring and identification of key solar phenomena such as sunspot groups, coronal holes and filaments, those are three major solar sources causing the space weather.


