Quoted from: Cox, P. M.: Description of the TRIFFID Dynamic Global Vegetation Model, Hadley Centre Technical Note HCTN 24, Met Office, FitzRoy Road, Exeter EX1 3PB, UK. https://jules.jchmr.org/sites/default/files/HCTN_24.pdf
TRIFFID defines the state of the terrestrial biosphere in terms of the soil carbon, and the structure and coverage of five plant functional types (Broadleaf tree, Needleleaf tree, C3 grass, C4 grass and shrub). The areal coverage, leaf area index and canopy height of each PFT are updated using a "carbon balance" approach, in which vegetation change is driven by net carbon fluxes calculated within the "MOSES 2" land surface scheme. MOSES 2 is a "tiled" version of the land surface scheme described by Cox et al (1999), in which a separate surface flux and temperature is calculated for each of the landcover types present in a GCM gridbox. In its standard configuration, MOSES 2 recognises the five TRIFFID vegetation types plus four non-vegetation landcover types (bare soil, inland water, urban areas and land ice). Carbon fluxes for each of the vegetation types are derived using the coupled photosynthesis-stomatal conductance model developed by Cox et al (1998), which utilises existing models of leaf-level photosynthesis in C3 and C4 plants (Collatz et al (1991), Collatz et al (1992)). Full details of this part of MOSES 2 are given in appendix A. The resulting rates of photosynthesis and plant respiration are dependent on both climate and atmospheric CO2 concentration. Therefore, with this carbon-balance approach, the response of vegetation to climate occurs via climate-induced changes in the vegetation to atmosphere fluxes of carbon.
Figure 1 is a schematic showing how the MOSES 2 land-surface scheme is coupled to TRIFFID for each vegetation type. The land-atmosphere fluxes (above the dotted line) are calculated within MOSES 2 on every 30 minute GCM timestep and time-averaged before being passed to TRIFFID (usually every 10 days). TRIFFID (below the dotted line of figure 1) allocates the average net primary productivity over this coupling period into the growth of the existing vegetation (leaf, root and wood biomass), and to the expansion of the "vegetated area". Leaf phenology (bud-burst and leaf drop) is updated on an intermediate timescale of 1 day, using accumulated temperature-dependent leaf turnover rates. After each call to TRIFFID the land surface parameters required by MOSES 2 (e.g. albedo, roughness length) are updated based on the new vegetation state, so that changes in the biophysical properties of the land surface, as well as changes in terrestrial carbon, feedback onto the atmosphere (figure 2). The land surface parameters are calculated as a function of the type, height and leaf area index of the vegetation, as described in section 6.
Unlike the simplest asynchronous coupling techniques this structure ensures consistency between the surface hydrological states "seen" by the atmosphere and the vegetation. This is achieved by having a strong demarcation between the processes represented in TRIFFID and those represented in the MOSES 2 land-surface scheme. Specifically, MOSES 2 calculates instantaneous carbon fluxes (consistent with the modelled surface energy and water fluxes) using parameters provided by TRIFFID, whilst TRIFFID updates the vegetation and soil state (and associated parameters) using the accumulated fluxes passed from MOSES 2.
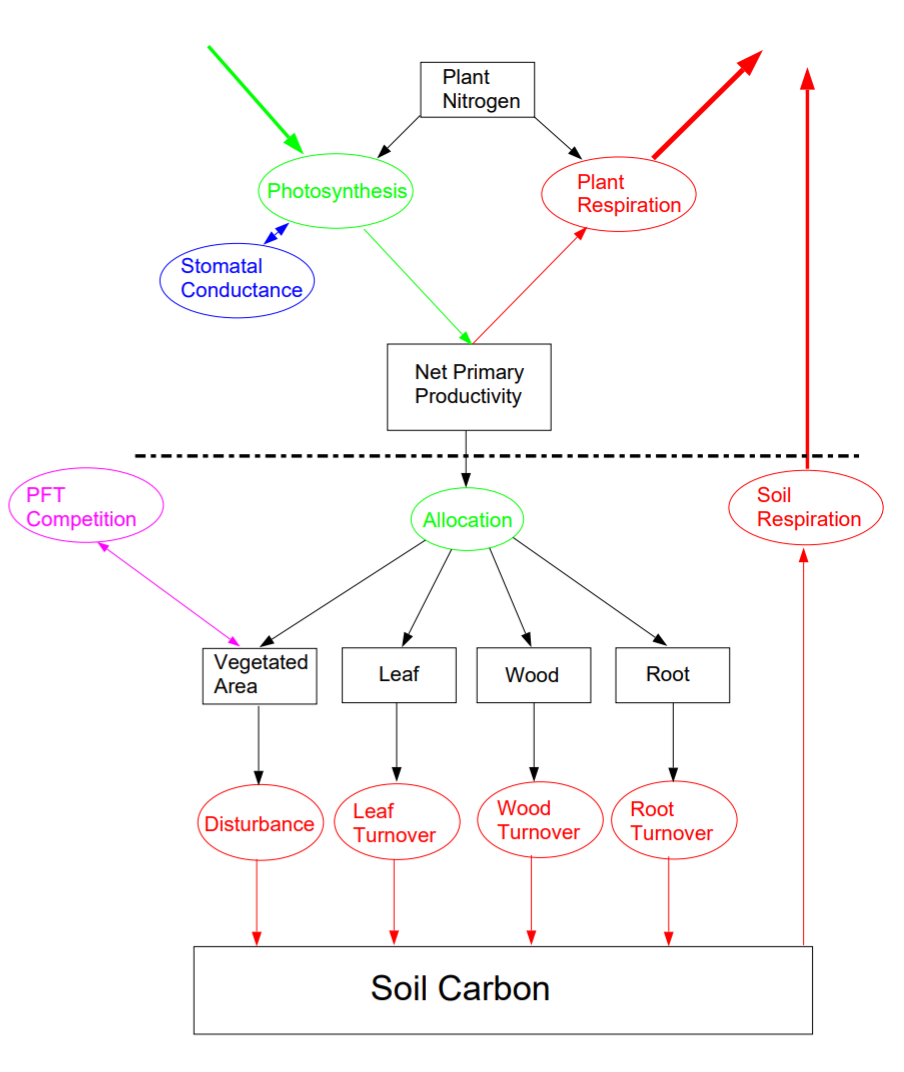
Figure 1: Schematic showing TRIFFID carbon flows for each vegetation type. Processes above the dotted line are fluxes calculated in the MOSES 2 land surface scheme every atmospheric model timestep (30 minutes). In dynamic mode, TRIFFID updates the vegetation and soil carbon every 10 days using time-averages of these fluxes.
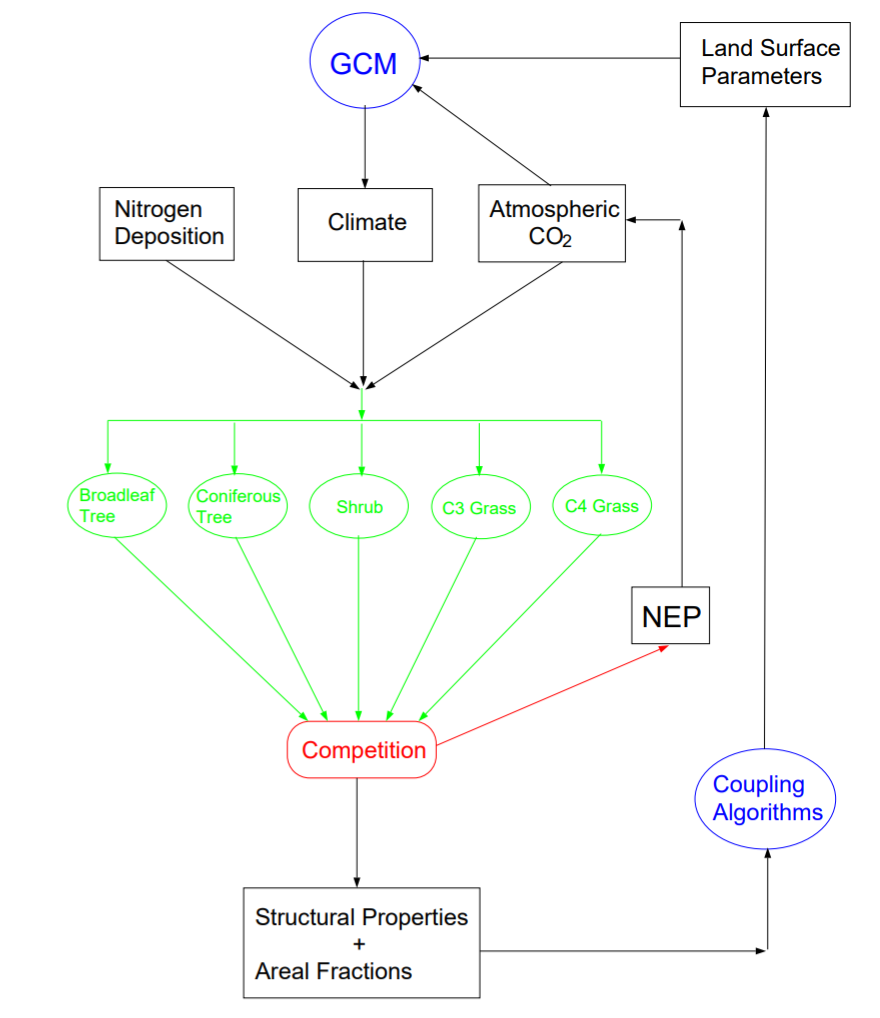
Figure 2: Schematic showing the coupling between TRIFFID and the GCM. Changes in the distribution and structure of the five plant functional types can provide a feedback to climate via two routes. The vegetation determines the biophysical land-surface parameters (e.g. albedo, roughness length, stomatal conductance) which in turn affect the land-atmosphere fluxes of heat, water and momentum. In addition, changes in the carbon stored in vegetation and soil (as measured by the net ecosystem productivity, "NEP") can change the evolution of atmospheric CO2 and thus the climate through the greenhouse effect. For completeness nitrogen deposition is also shown as a driver for vegetation change, although this version of TRIFFID does not include an interactive nitrogen cycle.


