Individual-based model
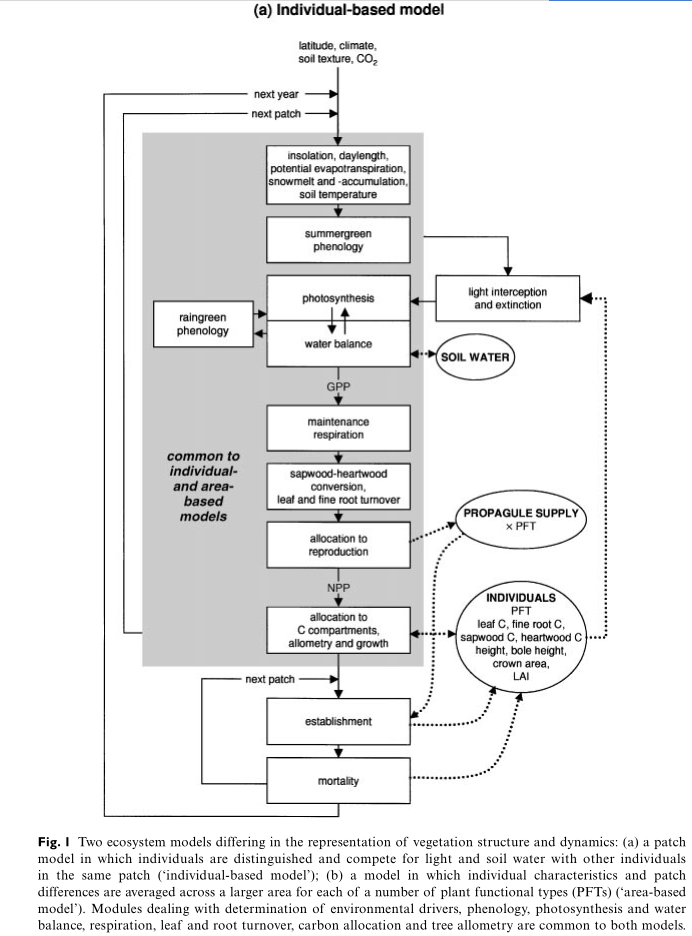
The structures of the two models are shown schematically in Fig. 1. Model (a), called the General Ecosystem Simulator (GUESS; B. Smith, I.C. Prentice, S. Sitch & M.T. Sykes, unpublished), simulates the growth of individuals on a number of replicate patches, corresponding in size approximately to the maximum area of influence of one large adult individual (usually a tree) on its neighbours. Patches are independent in terms of physical resources; that is, plants on different patches do not affect one another in the capture of light or uptake of water. However, patches are assumed to be close enough together to share a common propagule pool, establishment of new saplings of each PFT after initial colonization being directly related to the reproductive output of all individuals of that PFT the previous year (the‘spatial mass effect’; Shmida & Ellner, 1984).
Each woody individual belongs to one PFT (cf. taxon), with its associated parameters controlling establishment, phenology, carbon allocation, allometry, survival response to low light conditions, scaling of photosynthesis and respiration rates and the limits of the climate space the PFT can occupy. Carbon taken up through photosynthesis, and remaining following deduction of respiration and reproduction costs, is partitioned among the compartments leaf mass, fine root mass and sapwood mass, subject to certain constraints (including a constant ratio of sapwood cross-sectional areato leaf area; the pipe model of Shinozaki et al.,1964), and to the balance between light and water limitation to photosynthesis (Haxeltine & Prentice,1996). Each simulation year, a PFT-specific proportion of leaf mass and root mass is turned over(lost to individuals), and a fixed proportion of sapwood is converted to heartwood: relatively more for shade-intolerant PFTs. Stem diameter, crown area and plant height are related to the sum of sapwood and heartwood mass (Huang et al., 1992;Zeide, 1993), while bole height (the minimum height reached by the crown cylinder of each tree) is controlled by a PFT-specific minimum PAR level for photosynthesis.
Individuals are not distinguished for grasses.A layer of grass at ground level in each patch is treated as two ‘individuals’ — one each with the C3 and C4 photosynthetic pathways. Each grass is represented by patch totals of leaf and root carbon. Partitioning of assimilated carbon is done according to the balance between water and light limitation, as for trees.
Carbon uptake through photosynthesis, plant evapotranspiration and soil water content are calculated on daily (for water balance) and monthly (photosynthesis) timesteps by a coupled photosynthesis and water module derived from the BIOME3 equilibrium biosphere model (Haxeltine & Prentice, 1996). The amount of carbon fixed by each individual each year is influenced by the quantity of photosynthetically active radiation (PAR) captured and by stomatal conductance, the latter being reduced when atmospheric evapotranspirational demand exceeds the maximum transpiration rate with fully open stomata, i.e. in the presence of water stress.
The fraction of incoming PAR captured by each individual across its crown area is calculated daily using the Lambert–Beer law (Monsi & Saeki, 1953), which represents an exponential reduction in available light through the canopy, based on the accumulated leaf area index (LAI, the ratio of accumulated leaf area to ground area) above a given height in each patch (Prentice & Leemans, 1990). Sun angle is not directly taken into account. PAR reaching ground level, and exceeding a minimum level for assimilation, is taken up by grasses, which are assumed to cover the entire patch area (partitioned between the C3 and C4 types according to their relative LAIs). The amount of carbon available for allocation at the end of a simulation year is reduced by maintenance and growth respiration, leaf and root turnover, and a fixed fractional allocation to reproduction for mature woody plants and all grasses.
Model formulations of establishment and mortality are based on those employed within the ‘forest gap’ model FORSKA (Leemans & Prentice, 1989; Prentice et al. , 1993). The number of new saplings of each woody PFT and in each patch each year is drawn at random from the Poisson distribution, with an expectation influenced by a PFT-specific maximum establishment rate andby the ‘propagule pool’, i.e. the amount of carbon allocated to reproduction by all individuals of the PFT at all patches the previous year. No saplings are established in a given patch if the minimum PAR level at the forest floor is below a PFT-specific threshold, which is higher for more light-demanding species.
Mortality of individuals is stochastic and is based on the sum of a background rate, inversely related to the PFT-specific mean non-stressed longevity, and a much higher rate, imposed only when the 5-year average mean growth efficiency (the ratio of individual net annual production to leaf area) falls below a PFT-specific threshold. The latter is higher for more light-demanding species.
Area-based model
In contrast to the individual-based model, in which differences in size and form among individuals influence their resource capture and subsequent growth, model (b) (Fig. 1), an adapted version of the LPJ (Lund-Potsdam-Jena) dynamic global vegetation model (Sitch, 2000; S. Sitch, I.C. Prentice, B. Smith & LPJ Consortium Members, unpublished), implicitly averages individual and patch differences across a wider area and across ‘populations’ of PFTs. The approach has the advantage of being far less computation-intensive and, since intrinsically stochastic parameters such as establishment and mortality rates can be specified as averages, the predictions obtained are deterministic, and there is no need to perform multiple simulations, or to model a number of replicate patches, as required with the individual-based model. The principal disadvantage of the area-averaging approach is that the processes of competition for light and soil resources, which are essentially neighbourhood phenomena in nature, cannot be represented in a very mechanistic way. This might give rise to less robust predictions when the model is run using different environmental (climate/ radiation/CO2, etc.) drivers from those under whichit was calibrated.
Woody PFTs are represented by the density of individuals per unit area and carbon content per unit area in the four compartments leaf mass, fine root mass, sapwood mass and heartwood mass, as averages across the area modelled. Mean stem diameter, height and crown area are calculated from the sum of sapwood and heartwood mass per individual, using the same set of allometric relationships as in the individual-based model. Grasses are represented only by the leaf and root compartments.
Foliar projective cover (FPC), the proportion of ground area covered by leaves, is calculated for each PFT as the product of the fraction of incident PAR absorbed (from the Lambert–Beer law, given mean individual LAI), mean individual crown area and mean number of individuals per unit area. The sum of FPCs for all PFTs is constrained to remain≤1, the difference representing ground area remaining to be colonized. PFTs ‘compete’ for occupation of space through growth, which can increase their FPC.
Carbon uptake is modelled, as in the individual-based model, using the BIOME3 coupled photosynthesis and water balance module, but the photosynthesis values obtained are area-based averages for each PFT (i.e. gross primary production, GPP), rather than totals for each individual as in the other model. The fraction of PAR captured is the FPC, multiplied by one-half to account for losses to non-photosynthetic structures and to the soil (Landsberg, 1986; Haxeltine & Prentice, 1996). Net primary production (NPP), the amount of carbon per unit area remaining for allocation to plant tissues, is reduced by maintenance and growth respiration, leaf and root turnover, and allocation to reproduction, which are modelled using the same formulations as in the individual-based model.
Establishment and mortality are modelled in as similar a way as possible to the individual-based model, given that each PFT is represented only by one ‘average individual’ and by the spatial density of individuals. Establishment takes place each simulation year. The number of new ‘saplings’ per unit area is proportional to a PFT-specific maximum establishment rate and to the current FPC of the PFT concerned (a spatial mass effect), and declines in proportion to canopy light attenu-ation when the sum of woody FPCs exceeds 0.9 and approaches 1, simulating a decline in establish-ment success with canopy closure (Prentice et al.,1993). New saplings are allowed only in the proportion of the grid cell not covered by woody vegetation, and this proportion may be reduced further by the total fractional area in which the mean forest-floor PAR level is below a PFT-specific threshold (which is higher for more light-demanding PFTs). New saplings have the effect of increasing the number of individuals per unit area, and adjusting other PFT state variables to reflect the new population means. The net effect is always a marginal increase in FPC.
Mortality is modelled by a fractional reduction in all state variables, including the number of individuals per unit area. A background mortality rate, the inverse of mean PFT longevity, is applied each year. An additional stress mortality rate has two components, one inversely related to mean growth efficiency (which would be negatively influenced by, e.g. drought), the other to ‘shading’, which is assumed to increase exponentially as the sum of woody FPCs approaches 1. Light-demanding PFTs experience a higher rate of shading mortality than shade-tolerant ones. The net effect of mortality is a marginal decrease in FPC, creating new space for PFT expansion by growth and establishment.